-
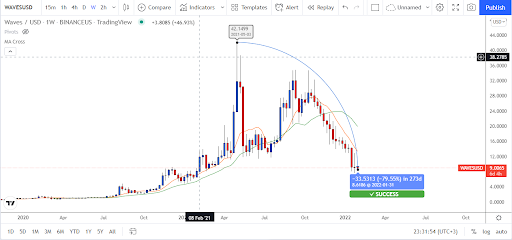
The price of WAVES has been spiraling down without a halt.
-
WAVES is seeing slight resistance at $10.3.
-
WAVES/USD is currently trading at $9.13.
 Source – TradingView
The Waves pricing shows a strong bearish trend, with bears dominating the price charts for the majority of the months since October. After being rejected at $10.3 on January 27th, the price levels have sharply plummeted, and the coin value has dropped to the $9 zone. The collapse had an effect, and the bearish trend has persisted today.
WAVES/USD one-day price chart: bulls advanced to $12.8 resistance level
Over the weekend Waves price evaluation indicated a negative trend, and the price has dropped to $8.55 today. The previous week's price chart was characterized by red candlesticks, indicating that bears were continually pushing the price to fall; however, bulls also made strong gains on January 26th, taking the price point to $12.8. Since then, bears have been impeding upward price trends, but today, the bears have gained a little profit as the price is currently locked in the $9.15region.
The MA is trading at $9.55, barely under the price point, while also remaining below the SMA50 curve, indicating a negative trend. Conversely, if we look at the 9 days Simple Moving Average signals, the resistance is at $16, indicating the highest volume pressure is at that level.
The four-hour Waves pricing assessment reveals that the bulls dominated the price component for most of today's trading period, but bears triggered a sharp price drop today, following a continuous bullish lead. Despite the negative momentum being low, it has outperformed the bullish momentum and made the daily candlestick bearish. Yet, the value has been seen to be


