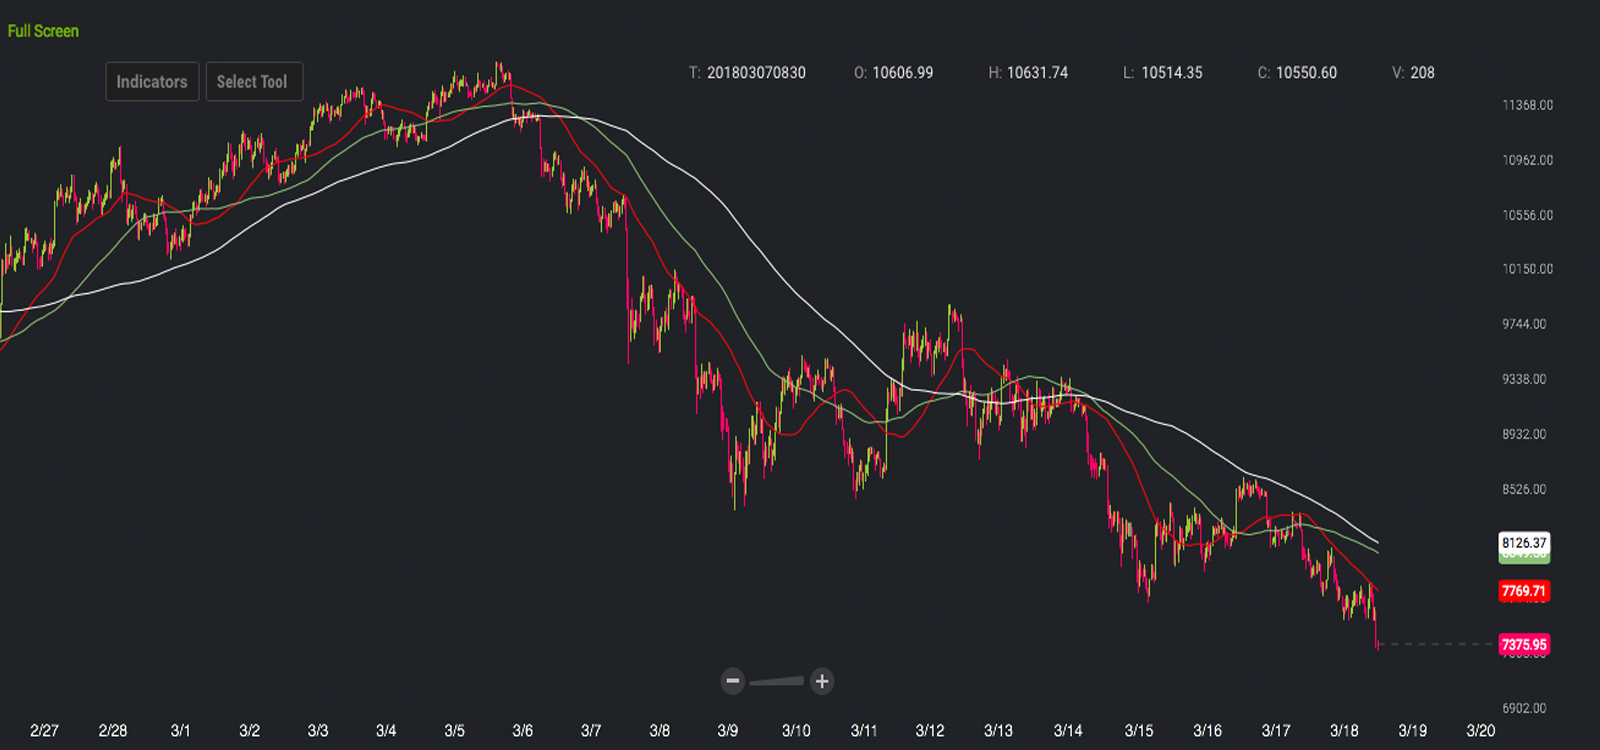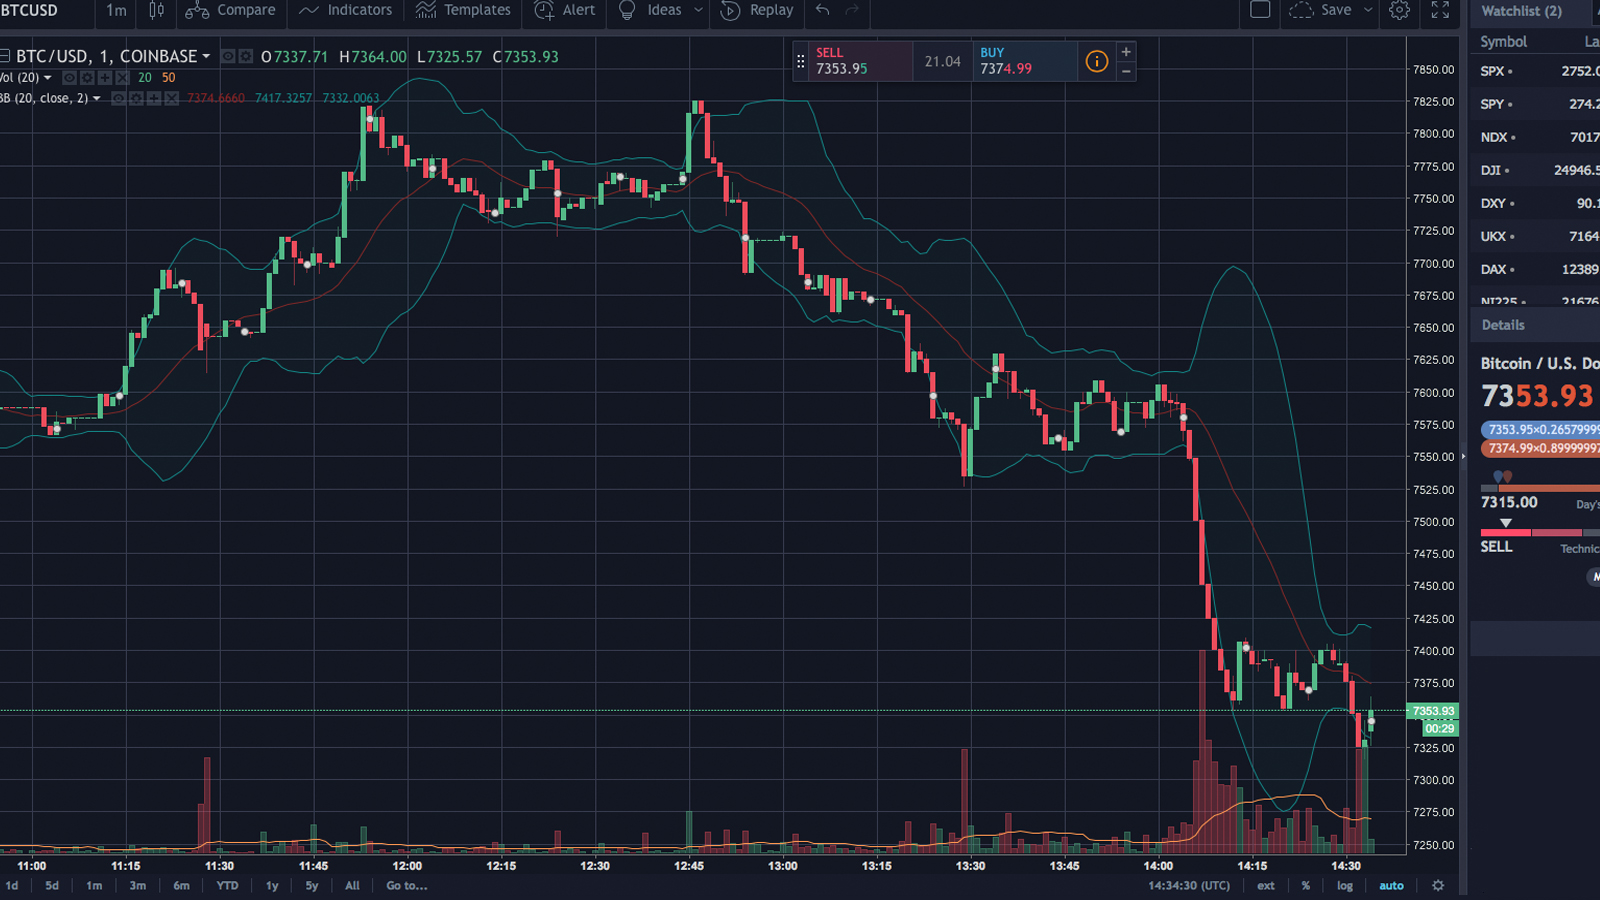
Cryptocurrency markets are still following a bearish pattern, leaving many digital asset traders uncertain. BTC/USD values have plummeted to levels not seen since the first week of February as the price per coin had touched a low of $7,325 on March 18. Moreover, the whole digital asset economy is suffering from losses as the entire cryptocurrency market capitalization has dropped to a low of $285Bn.
Also read: Japan’s DMM Bitcoin Exchange Opens for Business With 7 Cryptocurrencies
How Low Can You Go?
Digital assets are touching some lows again as market values this week have dropped 50-60 percent for nearly every single cryptocurrency in existence. Values are down anywhere between 4-25 percent looking at the top 100 coins on Coinmarketcap, and only the controversial ‘stable coin’ tether remains unaffected. BTC trade volume is decent this weekend as volume picked up when the price touched $8,600 on March 16. Trading volume for BTC markets has been roughly around $4-7Bn every day for the past four days. Volumes surely look lower than this December, but analysts should also take into account the price per coin has halved.

The top five exchanges swapping the most BTC today includes Bitfinex, Binance, Okex, Bitflyer, and Huobi. Bitfinex trade volumes lead the pack with close to $500Mn over the past 24-hours. The Japanese yen is still dominating the BTC volume by currency as it captures 52 percent of trades today. This is followed by the USD (24%), tether (USDT 13.4%), the euro (3.5%), and the South Korean won (3.3%). The most popular trade on Shapeshift today is ethereum (ETH) for BTC.
 At the time of writing 11:30 am EDT – BTC/USD average is $7,380.
Technical Indicators
Looking at the weekly, daily and 4-hour charting signs still look uncertain and bearish for BTC/USD markets. The short-term 100 Simple Moving Average (SMA) is above the longer term 200 SMA, indicating continued bearish sentiment. For the first time in nine months, BTC/USD’s 50-day moving average has dipped super close to the 200-day moving average as well. The MACd is coasting along around -333 and both RSI and Stochastic oscillators are heading southbound, and the price will likely follow suit. Most traders think we may see a “double bottom” which means the cost per BTC could touch $5,900 again before a reversal. Others believe the price will only drop to the $7,200 level (the 78.6 Fibonacci retrace), and markets may change sentiment from there.
 BTC/USD morning (EDT) trading sessions saw a low of $7,325.
Order books show some strong support up until the $7,150 range, and if BTC values break below that price region, a double bottom ($6K or lower) could very well be in the cards. On the flip side the sell walls up to $8K and higher are not too bad and could easily be broken, but the bullish volume is not there. If bulls can muster up some strength when the bears become exhausted, there


