Over the years there have been many news.Bitcoin.com tutorials about the very basics of trading, market indicators, and the multitude of websites that collect vast amounts of data. Some of these resources give traders a step towards making their first trades. Now after a few losses and some lucky gains these individuals are interested in how to read the market.
Also Read: PBOC to Strengthen Cryptocurrency Regulations in 2018
Confidence is Silent
 Head n Shoulders pattern.
Learning to trade can be difficult but there are so many experts in the field and online resources that can teach anyone to trade cryptocurrencies. The first thing to realize is that bitcoin markets or any cryptocurrency markets are very different than your average stock or FX trading arenas. In fact, many people will tell you that traditional technical analysis (TA) will never be accurate when it comes to digital currency markets. However, there are those that use TA regularly to day trade, make a living, and predict the short-term price swings we all know and love.
The first thing a trader should get to know is the most common financial chart used in the cryptocurrency industry which is the candlestick chart. The size of each candlestick represents a certain time interval, and individuals who study TA look for patterns in the market. This is when you will hear about certain chart patterns like the ‘Head n Shoulders, the Cup n Handle, Triple Top & Triple Bottom,” and many more funky phrases. However, these pattern help traders predict cryptocurrency price movements in the short and long term. They say after memorizing enough patterns individuals can see them subconsciously while day trading.
 Studying Japanese candlestick charts can produce patterns that may be helpful towards predicting short and long-term price movements.
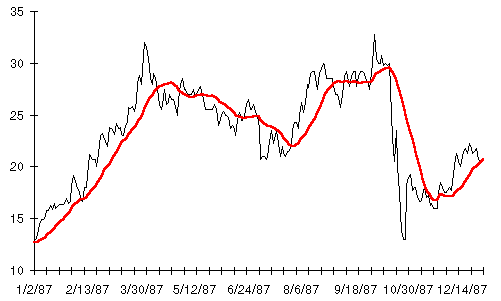
Cryptocurrency traders then take things to the next level by using a wide variety of tools that are also known to help forecast price movements in markets. One of the biggest indicators in the market many traders utilize is moving average data. For instance, a Simple Moving Average (SMA) is used by calculating the average of a digital assets closing value over a set interval. An Exponential Moving Average (EMA) and Displaced Moving Average (DMA) are more complex than the SMA. An EMA responds in a swifter manner to price fluctuations while the DMA is moved in set periods of time so a trader can predict market trends.
 Moving averages are common trendlines followed by traders.
Another helpful tool used in trading digital assets is the Relative Strength Index (RSI). The oscillator basically determines the price momentum whether it climbs or falls. The measurement of speed is recorded between 0-100 and it’s one of the most popular trading indicators in many markets. The squiggly line typically meanders about sideways, or up or down, and if the line dips below 30 the


