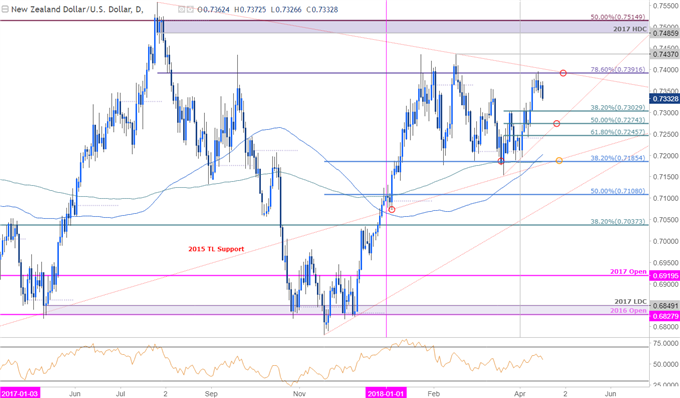
The New Zealand Dollar[1] reversed sharply off the yearly high-day close at 7390 on Friday. The pullback is now testing initial areas of support, which if broken, could clear the way for a larger correction in price. For now, here are the levels to consider.
NZD/USD Daily Price Chart

Technical Outlook: In this week’s Technical Perspective[2], we highlighted that the Kiwi rally was, “eyeing range resistance at 7390 (yearly high-close)” with the immediate long-bias at risk while below this threshold. An outside-day reversal off this level on Friday further casts a near-term bearish outlook on price with daily momentum also pulling back from 60.
New to Forex[3] Trading? Get started with this Free Beginners Guide[4]
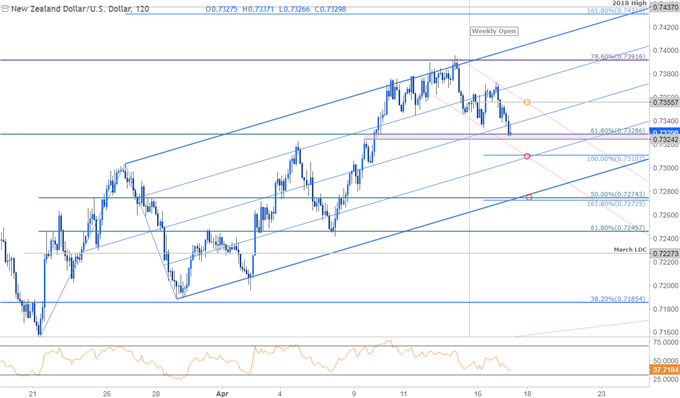
NZD/USD 120min Price Chart

Notes: A closer look at price action see’s NZD/USD trading within the confines of an ascending pitchfork[5] formation extending off the March lows. The reversal off the upper parallel has continued to respect this embedded descending channel formation and keeps the near-term focus lower while below 7356 where the weekly open converges on the channel resistance. The decline is testing near-term support here at 7324/29 with more significant support eyed at 7310- a break there targets a larger correction towards median-line support ~7273/74.
Why does the average trader lose? Avoid these Mistakes in your trading[6]
Bottom line: Kiwi has reversed off upslope resistance and the burden of proof is on a break below parallel support to suggest a more significant high is in place. From a trading standpoint, I’ll favor fading strength while below the weekly open. A


