In this series we scale-back and take a look at the broader technical picture to gain a bit more perspective on where price is trading with respect to trend. Here are the key technical levels that matter on the weekly charts heading into the weekend.
EUR/USD Weekly Chart

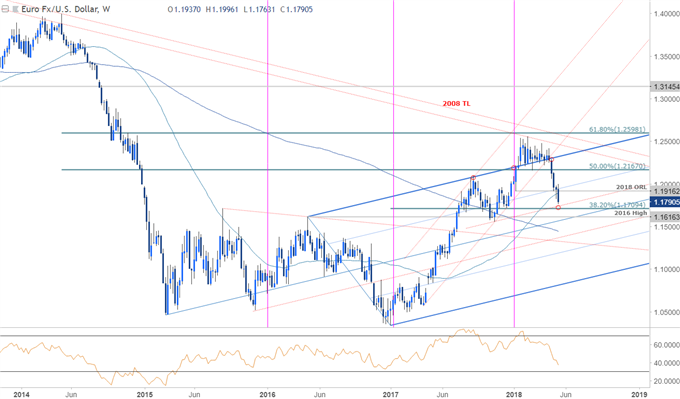
Notes: EUR/USD[1] broke below confluence slope support last month with the decline breaking below the yearly opening range lows at 1.1916. Price is now approaching confluence support around 1.1709/45 where the 38.2% retracement of the late-2016 advance converges on a parallel of the dominant slope[2] extending of the November low (red). Ultimately the outlook remains weighted to the downside while below the yearly but IF Euro[3] is going to rebound (at least in the short-term) this would be a good spot.
Bottom line: The immediate EUR/USD decline is at risk heading into the 1.17-handle. Initial resistance[4] stands back at 1.1916 with a breach above the yearly open at 1.2005 needed to alleviate further downside pressure. That said, a break lower from here would target subsequent support objectives a 1.1616 where the 2016 high converges on the median-line. From a trading standpoint, this would be a good spot to reduce any short-exposure - we would need to see some convincing near-term price action before attempting a recovery play. Watch the weekly close.
EUR/USD IG Client Positioning

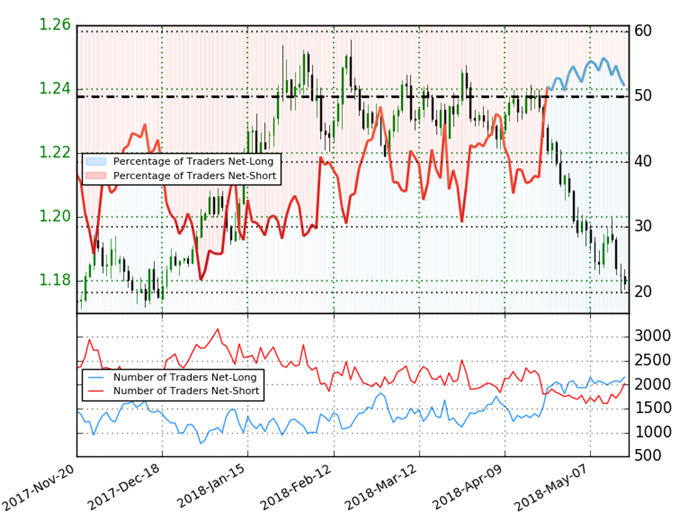
- A summary of IG Client Sentiment[5]shows traders are net-long EURUSD- the ratio stands at +1.09 (52.2% of traders are long) – extremely weak bearishreading
- Retail has remained net-long since April 30


