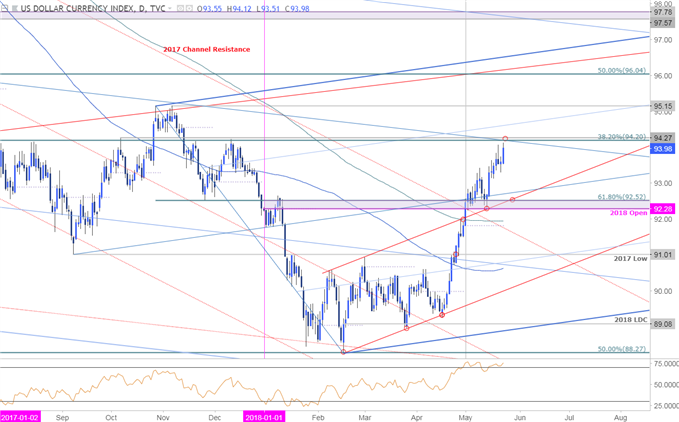
The USD has rallied more than 6% off the yearly lows with the advance now testing an area of confluent resistance which could limit further gains near-term. A near-term structure has been in play throughout the April-May advance and keeps the focus higher . . . for now.
USD Daily Price Chart (DXY)

Technical Outlook: In my latest Weekly Technical Perspective on the US Dollar[1], we noted that the DXY[2] was, “testing confluence resistance this week at 93.89-94.20 where the 2016 low-week reversal close and the 38.2% retracement of the 2017 decline converge on the median-line.” The index is trading in this region today and a daily close above is needed to keep the immediate USD uptrend viable.
Daily support rests at 92.52 with bullish invalidation set to the yearly open at 92.28. A topside breach of this threshold targets subsequent resistance objectives at 95.15 and the 50% retracement at 96.04.
New to Forex[3] Trading? Get started with this Free Beginners Guide[4]
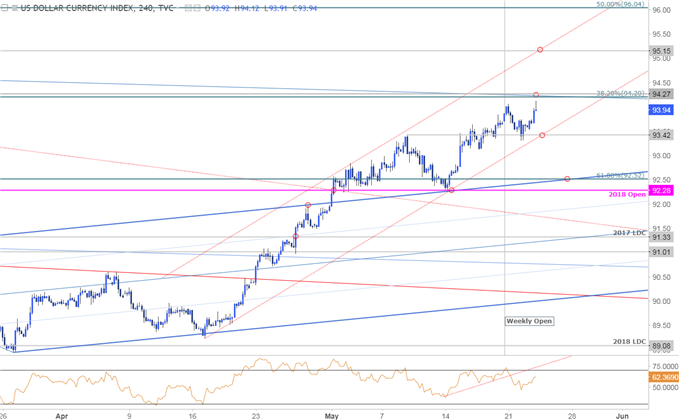
USD 240min Price Chart (DXY)

Notes: A closer look at USD price action sees the DXY trading within the confines of a well-defined ascending channel formation with the lower parallel highlighting near-term support at 93.42. Note that the momentum profile[5] will be marking bearish divergence into these highs IF this candle close at current levels. That said, we’ll be looking for a reaction on a stretch into 94.20/27 for possible exhaustion.
Why does the average trader lose? Avoid these Mistakes in your trading[6]
Bottom line: While the broader outlook remains


