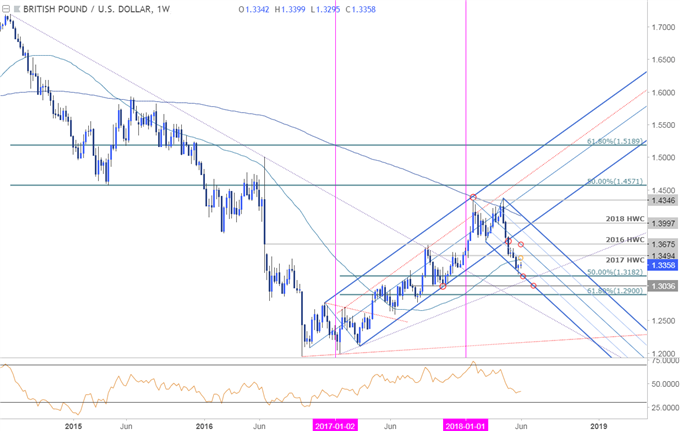
In this series we scale-back and take a look at the broader technical picture to gain a bit more perspective on where we are in trend. Here are the key levels that matter on the weekly charts for the British Pound (GBP/USD). Review this week’s Strategy Webinar[1] for an in-depth breakdown of this setup and more.
New to Trading? Get started with this Free Beginners Guide[2]
GBP/USD Weekly Price Chart

Notes: The British Pound is down more than 7% from the yearly highs with price continuing to trade within the confines of descending pitchfork formation[3] extending off January / April highs at 1.3182 (low registered at 1.3205). Note that weekly momentum held above 40 on this sell-off and IF price Sterling is going to bounce near-term, this would be a good spot.
Confluence resistance stands at 1.3450/94 where the 2017 high-week reversal close and the 52-week moving average converge on the 50-line of the downslope. A weekly close above this threshold would be needed to suggest a more significant low is in place with such a scenario targeting the 2016 high-week reversal close (Brexit) at 1.3675.
For a complete breakdown of Michael’s trading strategy, review his Foundations of Technical Analysis series on Building a Trading Strategy[4]
Bottom line: Sterling is testing downtrend support and the immediate short-bias remains at risk near-term while above 1.3182. From a trading standpoint, a final washout into this region may offer an opportunity to fade a portion of this decline[5]. That said, the broader outlook does remain weighted to


