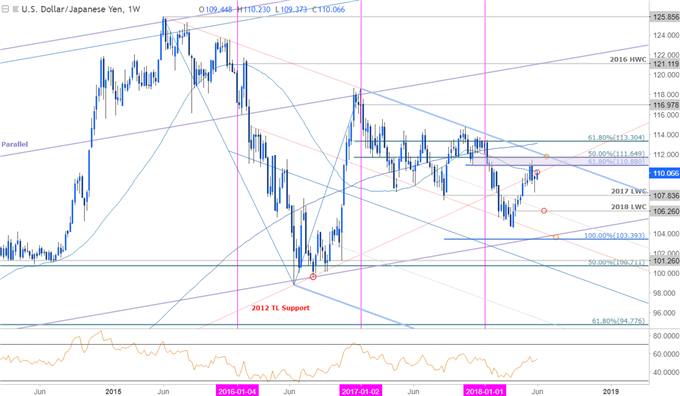
In this series we scale-back and take a look at the broader technical picture to gain a bit more perspective on where we are in trend. Here are the key levels that matter on the weekly chart for the US Dollar[1] vs the Japanese Yen (USD/JPY).
New to Forex Trading? Get started with this Free Beginners Guide[2]
USD/JPY Weekly Price Chart

Notes: USD/JPY posted an outside-weekly reversal off a key resistance range last month at 110.88-111.65 (bearish). The reversal marked the end of an eight-week rally in prices- in past instances of such an occurrence (9/2014 & 12/2013), the rally stalled out for at least a few weeks (shallow corrections), if not longer, before resuming higher. Note that slope resistance[3] extending off the 2015 highs converges on this resistance zone over the next few weeks and may limit further advances in the medium-term. The momentum profile also suggests the advance may be vulnerable here with weekly RSI[4] holding below the 60-threshold (sub-60 since early 2017).
Initial weekly support rests at 107.84 backed by the yearly low-week close at 106.26. A topside breach / close above this resistance range would be needed to mark resumption with such a scenario targeting the 200-week moving average / 61.8% retracement at 113.00/30.
For a complete breakdown of Michael’s trading strategy, review his Foundations of Technical Analysis series on Building a Trading Strategy[5]
Bottom line: The March rally in USD/JPY is testing its first major resistance hurdle here with the advance at risk in the medium-term while below


