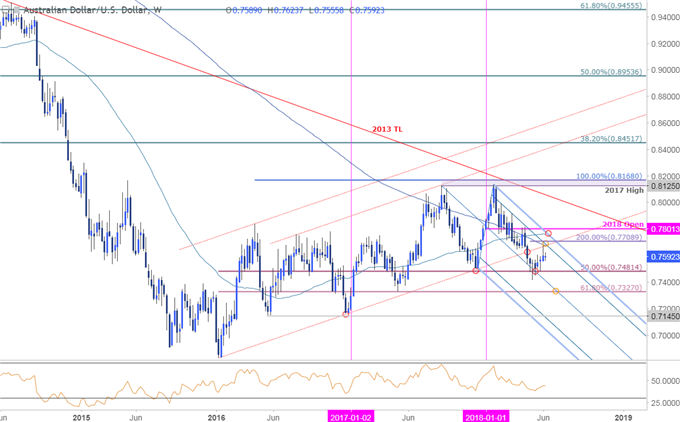
In this series we scale-back and take a look at the broader technical picture to gain a bit more perspective on where we are in trend. Here are the key levels that matter on the weekly chart for the Australian Dollar (AUD/USD) heading into the close of a big week of event risk. The weekly close will be critical here as Aussie probes key resistance levels. Review this week’s Strategy Webinar[1] for an in-depth breakdown of this setup and more.
New to Forex Trading? Get started with this Free Beginners Guide[2]
AUD/USD Weekly Price Chart

Notes: In last month’s AUD/USD Weekly Technical Perspective[3], we noted that the Aussie rebound was targeting, “initial resistance up towards 7636- a breach there would be needed to suggest that a larger reversal is underway / a more significant low is in place. A weekly close below 7480 would mark resumption for the broader downtrend with such a scenario targeting 7327. As noted in today’s webinar, for now, I’m willing to trade the long-side targeting slope resistance.”
Aussie registered a high at 7677 before pulling back sharply to close the week below the 76-handle (note the nearly perfect tag of former channel support extending off the 2016 low / 200-week moving average). So was that the high?
The verdict is still out but topside levels to keep in mind heading into the close of the month are the measured objective at 7709 and pitchfork resistance[4] / 52-week moving average at 7760s. Both of these levels represent areas of interest for possible exhaustion IF indeed Aussie is going


