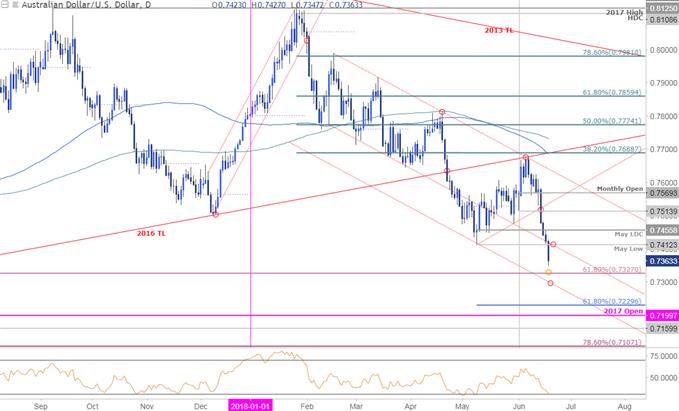
The Australian Dollar[1] has plummeted more than 9% off the yearly highs (nearly 6% year-to-date) with the decline now approaching initial support targets of interest. While the immediate risk remains lower in the Aussie, we’re on the lookout for near-term exhaustion in price. These are the updated targets & invalidations levels that matter for AUD/USD.
AUD/USD Daily Price Chart

Technical Outlook: In last week’s Technical Perspective on the Australian Dollar[2], we revisited the Aussie setup[3] we’ve been track since the start of the month after price pulled back from the 2016 trendline. We noted that, “From a trading standpoint, the immediate threat may still be higher for the Aussie in the days ahead but ultimately I’ll favor fading strength closer to structural resistance.”
That tuned out to be the high with the subsequent reversal breaking below the monthly opening-range[4] to fresh yearly lows. The next daily support target of interest rests at the 61.8% retracement of the entire 2016 advance at 7327 with parallel support[5] just lower around ~7290s.
Initial resistance stands at the former yearly lows at 7412 backed by the May low-day-close at 7456. Ultimately a breach above the 7514 would be needed to alleviate further downside pressure (bearish invalidation).
New to Forex[6] Trading? Get started with this Free Beginners Guide[7]
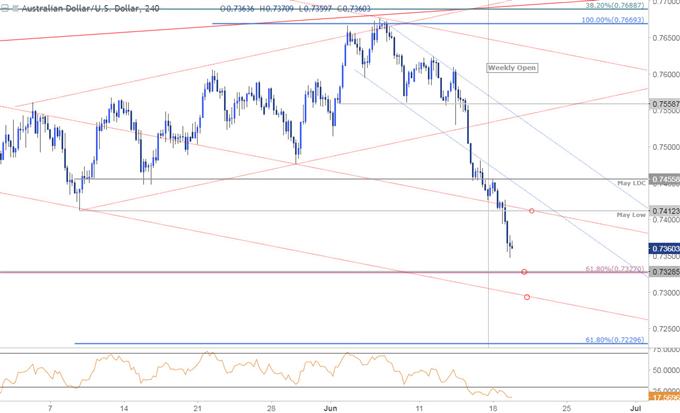
AUD/USD 240min Price Chart

Notes: A closer look at AUD/USD price action highlights the turn from confluence resistance last week at 7670/89. Note that intraday RSI[8] remains in deep in oversold territory


