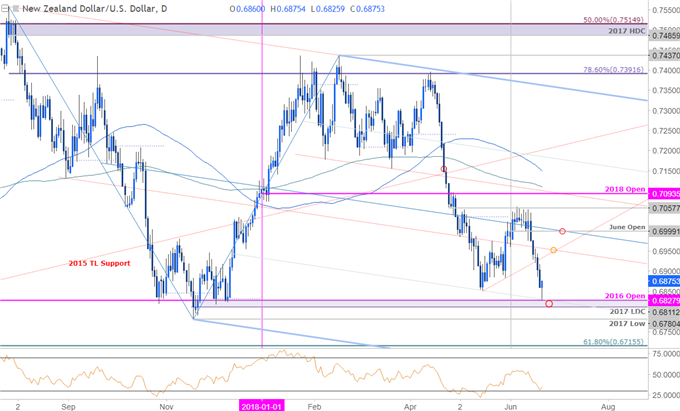
The New Zealand Dollar has fallen more than 3% from the monthly highs with a break of the June opening-range[1] shifting the focus toward a late-month low in NZD/USD. That said, the decline failed to hold a break below the May lows with a rebound off confluence support threatening a larger recovery in in price. These are the updated targets & invalidations levels that matter for NZD/USD in the near-term.
NZD/USD Daily Price Chart

Technical Outlook: In this week’s Technical Perspective on the New Zealand Dollar[2], we highlighted the breakdown in Kiwi while noting that, “price is now approaching levels support targets of interest that could interrupt this decline in the near-term.” The first region is defined by 6811/28 where the 2016 open and the 2017 low-day close converge on the 50-line of the descending pitchfork formation[3] extending off the 2017 & 2018 highs- price is responding to this threshold today.
Daily resistance stands at the highlighted trendline confluence around ~6940s with bearish invalidation up at the monthly open at 6999- a breach there would be needed to suggest a more significant low is in place for NZD/USD. A downside break / daily close below this support zone targets subsequent objectives at the 2017 lows at 6780 backed by the 61.8% retracement of the 2015 advance at 6716.
New to Forex[4] Trading? Get started with this Free Beginners Guide[5]
NZD/USD 120min Price Chart

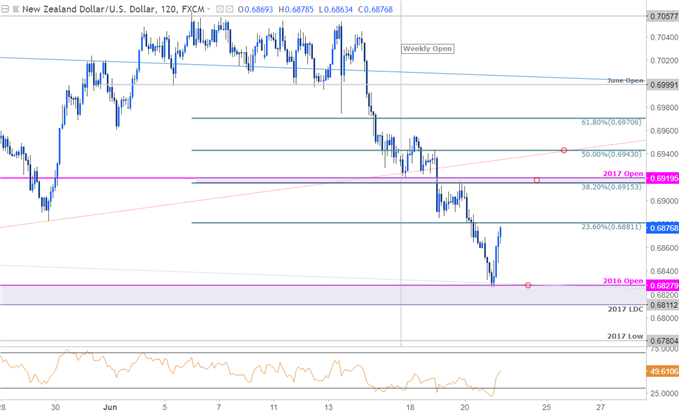
Notes: A closer look at NZD/USD price action highlights today’s reversal off support with the advance now eyeing initial resistance at the 23.6% retracement at 6881. IF


