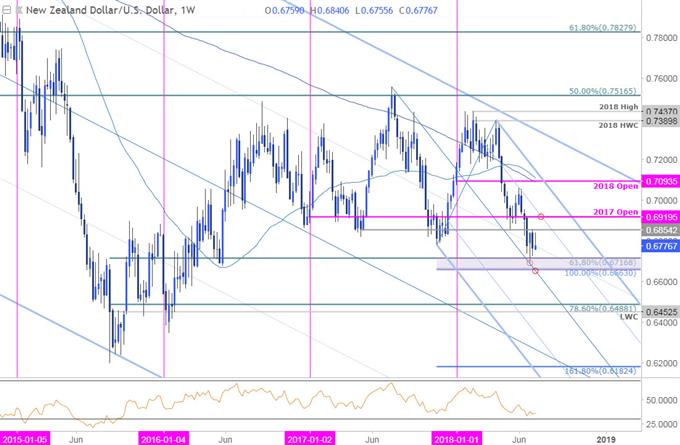
In this series we scale-back and take a look at the broader technical picture to gain a bit more perspective on where we are in trend. Here are the key targets & invalidation levels that matter on the New Zealand Dollar vs the US Dollar[1] (NZD/USD) weekly chart. Review this week’s Strategy Webinar[2] for an in-depth breakdown of this setup and more.
New to Forex Trading? Get started with this Free Beginners Guide[3]
NZD/USD Weekly Price Chart

Notes: The New Zealand Dollar stretched into al critical support zone last week at 6663-6717- a region defined by the 61.8% retracement of the 2015 advance and the 100% extension of the 2017 decline. Note that the median-line of the descending pitchfork formation[4] extending off the 2017 highs and further highlights the technical significance of the threshold.
Initial resistance stands at 6855 backed by the 61.8% line / 2017 open at 6920- a level of interest for possible exhaustion IF reached. A break lower from here risks substantial Kiwi losses with such a scenario targeting the 2015 low-week close / 78.6% retracement[5] at 6453/88.
For a complete breakdown of Michael’s trading strategy, review his Foundations of Technical Analysis series on Building a Trading Strategy[6]
Bottom line: Price is testing down-trend support and our final Kiwi target noted last month[7] with the broader short-bias at risk while above 6663 near-term. From a trading standpoint, look to reduce short-exposure heading into this regions and be on the lookout for possible


