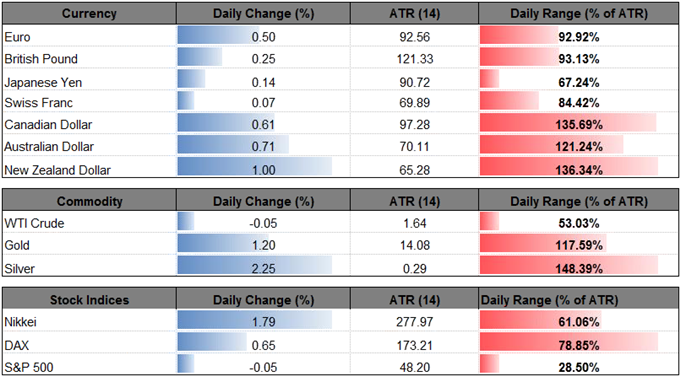
FX Talking Points:
- AUD/USD[1] Breaks Out of Narrow Range Even as Reserve Bank of Australia (RBA) Endorses Wait-and-See Approach. Dismal Australia GDP Report to Rattle Aussie-Dollar Rebound.
- USD/JPY Monthly Opening Range Hints at Larger Recovery as Bear-Flag Stalls, Relative Strength Index (RSI) Holds Above Oversold Territory.


AUD/USD breaks out of the narrow range from earlier this month even as the Reserve Bank of Australia (RBA) endorses a wait-and-see approach for monetary policy, but fresh updates to Australia’s Gross Domestic Product (GDP) report may rattle the near-term rebound in the aussie-dollar exchange rate as the growth rate is expected to slow to an annualized 2.5% from 2.8% in the third-quarter of 2017.
A material slowdown in the growth rate may curb the recent advance in AUD/USD as it encourages the RBA to keep the cash rate at the record-low, and the central bank may continue to tame bets for an imminent rate-hike as ‘inflation remains low, with both CPI and underlying inflation running a little below 2 per cent.’ The comments from Governor Philip Lowe and Co.[2] suggest the central bank is in no rush to implement higher borrowing-costs as ‘household incomes are growing slowly and debt levels are high,’ and it seems as though the RBA will continue to jawbone the local currency in 2018 as ‘an appreciating exchange rate would be expected to result in a slower pick-up in economic activity and inflation than currently forecast.’
As a result, the RBA’s wait-and-see approach may keep the broader outlook contained within a wide range especially as the 0.8150 (100% expansion) region continues to offer resistance, but recent price action raises the risk for a larger rebound in the aussie-dollar exchange rate as the bearish momentum carried over from the previous month appears to be abating.
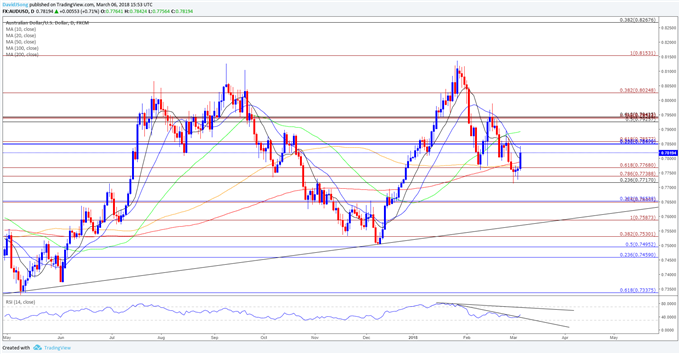
AUD/USD Daily Chart

- AUD/USD may stage a larger recovery as it snaps the bearish sequence from the previous week after failing to break/close below the 0.7720 (23.6% retracement) to 0.7770 (61.8% expansion), with the Relative Strength Index (RSI) snapping the bearish formation carried over from last month as it turns around ahead of oversold territory.
- Topside targets will come back on the radar on a break/close above the 0.7850 (38.2% retracement) to 0.7860 (61.8% expansion) area, with the next hurdle coming in around 0.7930 (50% retracement) to 0.7940 (61.8% retracement) following by the 0.8030 (38.2% expansion) region.

The recent decline in USD/JPY appears to be stalling as the pair initiates as fresh series of higher highs and lows during the first full-week of March, and the bear-flag formation may unravel over the coming days as the Relative Strength Index (RSI) starts to deviate with price.
Keep in mind, the broader shift in USD/JPY behavior may continue to unfold in 2018


