Talking Points:
- Gold prices[1] rise as US Dollar[2] falls, trade war jitters sink bond yields
- Deepening risk aversion may drive USD[3] recovery, hurting the metal
- Crude oil prices[4] may fall if EIA inventory data echoes API estimate
Gold prices surged as the US Dollar fell for a fourth straight day, boosting the standby anti-fiat alternative. The move probably reflected the revival of the “monetary policy catch-up” narrative. This envisions the erosion of the greenback’s expected yield advantage as other central banks follow the Fed’s hawkish lead.
The yellow metal got another push upward as trade war jitters re-emerged[5], souring market sentiment. That sent capital scrambling toward the safe haven of Treasury bonds, pushing yields sharply lower. Not surprisingly, that burnished the relative appeal of non-interest-bearing assets, gold included.
The way forward seems to portend more of the same, with futures tracking the FTSE 100[6] and S&P 500[7] stock benchmarks pointing decidedly lower before London and Wall Street come online. However, gold might not make the most of it if USD reclaims the haven role it often plays when risk aversion is extreme.
Crude oil prices continued to track US share prices, reveling in “risk-on” trade dynamics early in the day only to retreat as sentiment soured into the close. Adding to selling pressure, the EIA upgraded its 2018-19 US output projections while API said inventories added a hefty 5.66 million barrels last week.
Official inventory statistics are now on tap, with consensus forecasts pointing to a far more modest 2.19 million barrel build. A print closer in line with API projections may push prices downward. The move lower is likely to be amplified if “risk-off” cues in stock index futures find follow-through.
Learn what retail traders’ gold buy and sell bets[8] say about the price trend!
GOLD TECHNICAL ANALYSIS
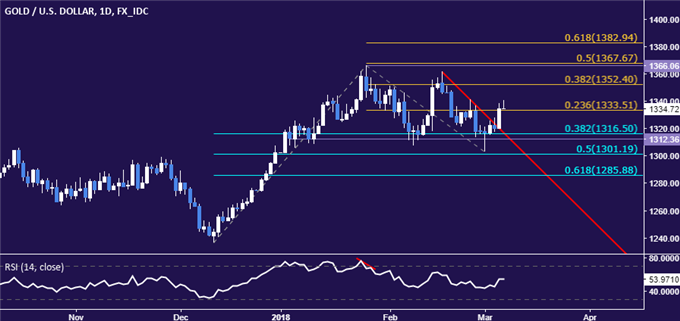
Gold prices punctured near-term trend resistance as well as the 23.6% Fibonacci expansion at 1333.51. The next upside barrier is marked by the 38.2% level at 1352.40, with a close above that exposing the 1366.06-67.67 area (January 25 high, 50% Fib). Alternatively, a move back below 1333.51 targets support in the 1312.36-16.50 zone (range floor, 38.2% Fib retracement).

CRUDE OIL TECHNICAL ANALYSIS
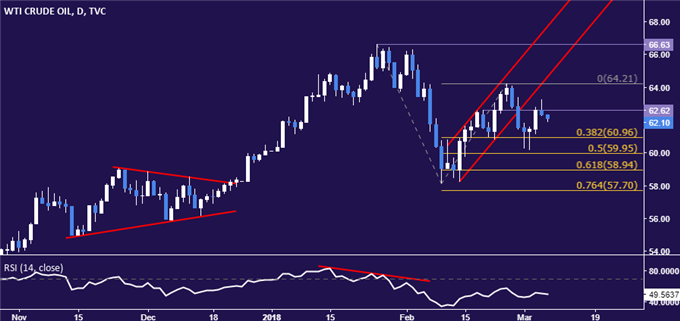
Crude oil prices conspicuously failed to hold above chart inflection point resistance at 62.62. From here, a daily close below the 38.2% Fibonacci expansion at 60.96 exposes the 50% level at 59.95. Alternatively, decisive breach of 62.62 paves the way for a retest of the February 26 high at 64.21.

COMMODITY TRADING RESOURCES
--- Written by Ilya Spivak, Currency Strategist for DailyFX.com
To contact Ilya, use the comments section below or @IlyaSpivak[9] on


