Talking Points:
- NZD/USD[1] one-week implied volatility is at a one-month high, hinting at elevated price action
- Next week on Wednesday, the Fed and RBNZ rate decisions are within 2 hours of each other
- The pair appears to be falling after a bearish reversal pattern was followed with confirmation
Just started trading NZD/USD and want apply next week’s profile into your setup? Check out our beginners’ FX markets guide[2]!
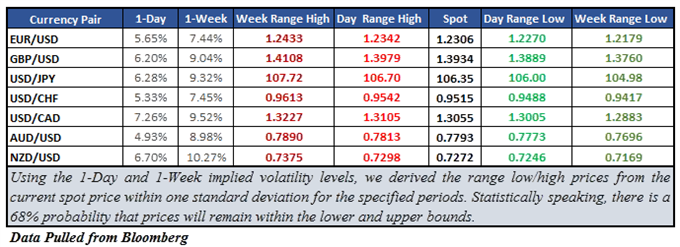
New Zealand Dollar[3] implied volatility levels continues to be elevated when comparing to other majors. Against the US Dollar[4], the one-week (1W) reading stands at 10.27% which is the highest since February 9th. That was back around the time when US inflation fears triggered a market-wide selloff which hurt the sentiment-sensitive currency. This time around, monetary policy seems to be the culprit in these pricings.
Implied Volatility and Market Range

Next week we will get the Fed and RBNZ rate decisions on the same day and within two hours of each other. The risk for the New Zealand Dollar in the former event, which is at 18:00 GMT on Wednesday, is how policymakers’ forward guidance impact sentiment. That is because a rate hike is unanimously priced in for this event, and Chair Jerome Powell has hinted the possibility for a fourth one this year back in February.
Then the RBNZ monetary policy announcement will cross the wires at 20:00 GMT. No rate change is expected and the markets have been slowly moving away from the idea that they could hike once by the end of the year. However, not all have lost hope and there is a chance that they could yet be disappointed. Overnight index swaps are pricing in a 38.7% probability that the central bank will act by its November meeting.
With that in mind, there is a good chance that NZD/USD implied volatility continues climbing as we get closer to this date. But for now, let’s see where the current levels may take the pair.
For other currency volatility-related articles please visit the Binaries page[5].
NZD/USD Technical Analysis: Dark Cloud Cover, Turning Lower?
On a daily chart, NZD/USD seems to have broken below near-term rising support after the formation of a dark cloud cover. This bearish reversal pattern does require confirmation, and that appears to have been fulfilled after the 14.6% minor Fibonacci retracement was pierced through at 0.7282.
From here, the “day range low” could stand in the way as immediate support over the next 24 hours. Looking beyond that, the March 1st low at 0.7186 would be the next target which is just above the February 8th low.
On the other hand, if prices


