Talking Points:
- Crude oil prices[1] torn as OPEC, IEA and API echo clouded macro view
- Gold prices[2] pressure range floor as markets look on to FOMC[3] meeting
- Commodities short of catalysts but stray headline risk remains a threat
Crude oil prices were unable to find a clear directional lead as a steady stream of forecasts from industry heavyweights offered little to resolve the central question plaguing traders: will swelling US production be met with enough of a counterweight in demand growth and OPEC-led output curbs to draw down inventories and boost prices?
Both OPEC and the IEA are now expecting the global supply glut to ease this year, with US demand for refined product projected to be the most robust since early 2007. That might have been supportive if not for a monthly report from API showed US production hit a new record high. That reminded investors higher prices will probably invite still more shale producers into the fray, capping upside follow-through.
Gold prices declined as the US Dollar[4] launched convincingly higher alongside front-end Treasury bond yields, undermining the appeal of anti-fiat and non-interest-bearing assets. The move appears to have reflected returning concerns about acceleration of the Fed rate hike cycle[5] ahead of next week’s much-anticipated FOMC monetary policy announcement.
Looking ahead, Baker Hughes rig count data, speculative positioning statistics from the ICE and the CFTC and US consumer confidence numbers from the University of Michigan are due. None of these outcomes are likely to make a dent in these broader macro narratives, leaving commodities to consolidate. The markets’ lingering sensitivity to rumor flow from Washington DC[6] warns against complacency however.
See our free guide to learn what are the long-term forces driving crude oil prices[7]!
GOLD TECHNICAL ANALYSIS
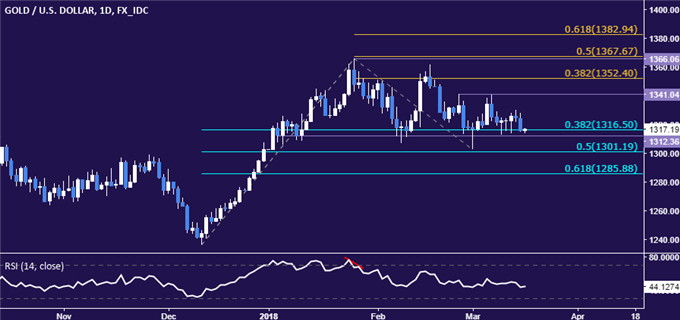
Gold prices are pressuring long-standing support in the 1312.36-16.50 area (range floor, 38.2% Fib retracement). Breaking below it on a daily closing basis opens the door for a test of the 50% level at 1301.19. Alternatively, a rebound through range resistance at 1341.04 exposes the 38.2% Fib expansion at 1352.40.

CRUDE OIL TECHNICAL ANALYSIS
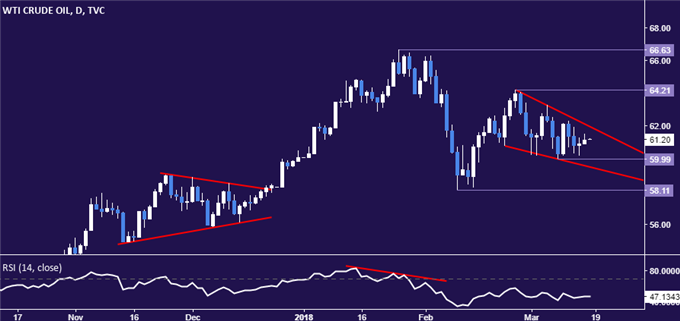
Crude oil prices continue to mark time within a Falling Wedge chart pattern, a typically bullish setup. Confirming as much on a daily close above its upper boundary at 61.94 clears the way for another challenge of the February 26 high at 64.21. Alternatively, a push below support in the 59.53-60.00 area (wedge floor, March 8 low) targets the February 9 bottom at 58.11.

COMMODITY TRADING RESOURCES
--- Written by Ilya Spivak, Currency Strategist for DailyFX.com
To contact Ilya, use the comments section below or @IlyaSpivak[8] on Twitter
To receive Ilya's analysis


